Statistics
Plasticulture in Europe
The volume of plasticulture marketed each year in Europe was approximately 674 000 tons in 2015, or 1.2% of the total plastic market consumed in Europe (56 MT). Sales for 2019 are estimated at 707.800 tons, for which for, corrected of the climate variation, this market is considered relatively stable overall. Nevertheless, it shows a great evolution in quality by an improvement of the characteristics and the functionalities of these plastics.
Plasticulture for crop production accounts for 46% of the market, and animal production 54%. Depending on the geographical area, they are distributed differently according to their specialty: Southern Europe is highly oriented towards vegetable production, while northern Europe is highly dependent on animal production.
If the market is reduced, it is characterized by high homogeneity in the polymers used, almost exclusively high and low density polyethylene (HDPE, LDPE) and polypropylene (PP). This homogeneity favors selective collection of used agri-plastics and recycling.
For a more detailed information sea the 2016 edition of Plasticulture Magazine : http://cipa-plasticulture.com/plasticulture-magazine/produit/plasticulture-magazine-2016-n-135/
Définitions : are considered as agri-plastics the non-packaging plastics products that have a direct agronomic effect on the crop or on its conservation such as irrigation pipes, drainage tubes, films and covers, forage’s twine and nets, shading an protecting nets, etc…
Sales by products in Europe
Plasticulture for Vegetable production

Total Tons new 319 500 T

Plasticulture for Animal production
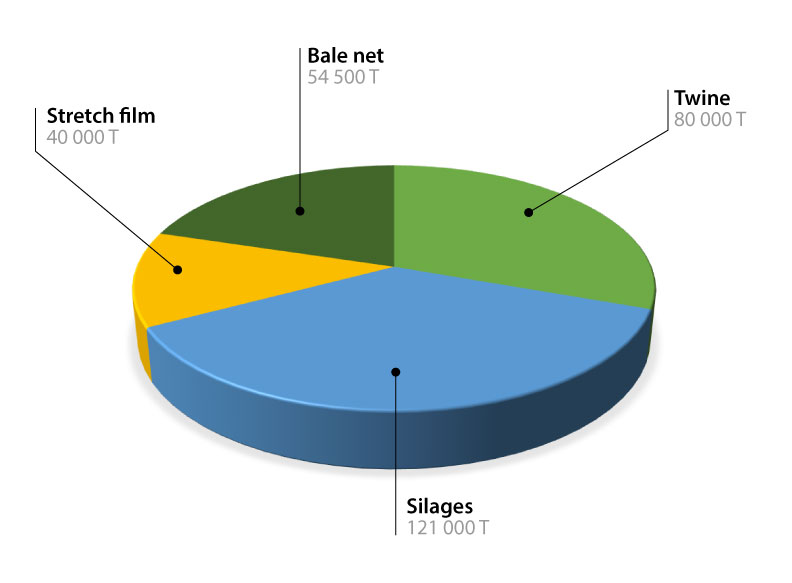
Total Tons new 397 000 T

Films sales by country
Methodology: these figures are approximations obtained by a combination of different sources such as installed surfaces figures, declared sales to existing schemes, studies and enquiries)
The operating scheme may communicate more detailed statistics to their members.
TOTAL Agri-Films Europe = 534 910 T

